Mitchell Palmer
Scientific Data Analyst
A Python project comparing ARIMA and LSTM approaches to inventory demand forecasting - built on synthetic data to demonstrate end-to-end analytical workflow and model evaluation.

This project applies Autoregressive Integrated Moving Average (ARIMA) statistical methods and Long Short Term Memory (LSTM) deep learning models to compare classical and neural approaches to demand prediction.
Both models used an 80/20 train/test split on daily demand data spanning January 2022 to January 2024. ARIMA order was selected via Autocorrelation Function (ACF) and Partial Autocorrelation Function (PACF) analysis with stationarity confirmed by Augmented Dickey-Fuller (ADF) test. The LSTM used a 60-lag sliding window with a two-layer architecture (64 units each), trained over 50 epochs.
- Retail Store Inventory Forecasting Dataset (Kaggle - Anirudh Chauhan).
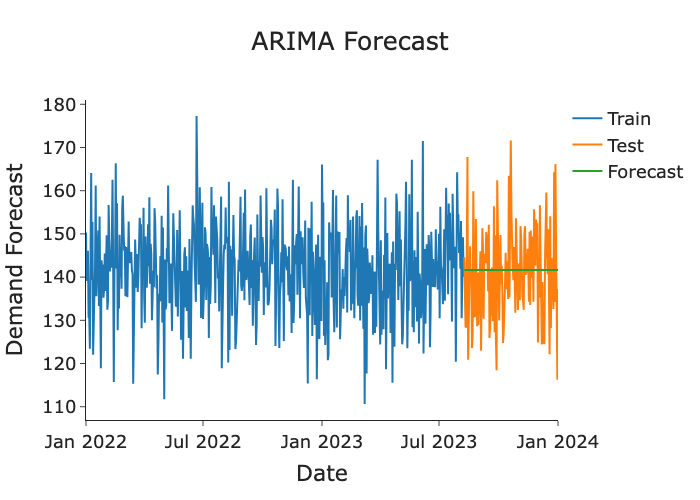
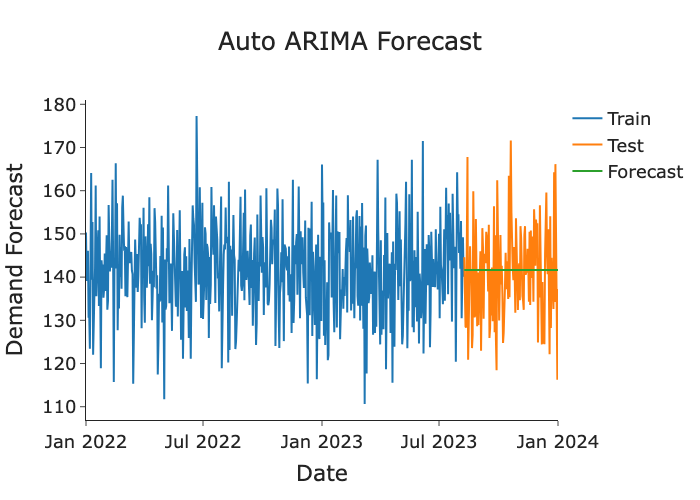
Both ARIMA and LSTM models converged to the mean of their respective targets, consistent with the absence of exploitable temporal signal in the synthetic data. Neither model demonstrated meaningful predictive skill beyond the baseline.
The ACF and PACF showed no significant signals, resulting in ARIMA order selection of (0,0,0), mathematically equivalent to a naive mean forecast, confirming no statistically significant autocorrelation structure in the series.
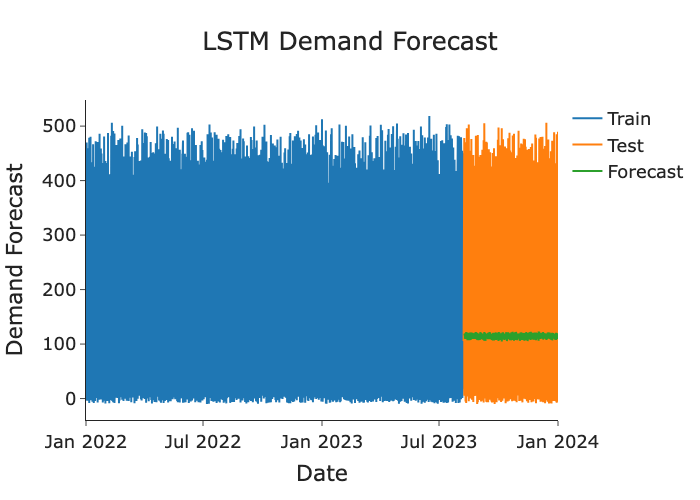
The LSTM was trained on individual daily demand records (mean ≈ 141, higher variance than the averaged ARIMA series). The flat green forecast line confirms the model defaulted to predicting the mean, consistent with the absence of learnable temporal signals observed in the ACF and PACF test.
This outcome is consistent with the synthetic data generating process: demand was simulated without a meaningful relationship between features and the target, leaving no exploitable temporal signal for either model to learn.
Note: ARIMA was applied to the daily averaged demand series (lower variance), while the LSTM was applied to individual records (higher variance). Metrics reflect these different targets and should not be interpreted as a direct head-to-head comparison.
- Data generating process determines model ceiling. When the underlying data contains no real temporal structure, neither classical nor deep learning models can manufacture signal. Diagnosing this early — through autocorrelation analysis and a naive baseline — avoids wasted modelling effort.
- Naive baselines are essential. Computing naive mean metrics alongside model metrics made it immediately clear that neither model was adding value — a check that should always precede model interpretation.
- Target granularity affects metrics significantly. Averaging a noisy series before modelling dramatically reduces variance and produces artificially low error scores. Ensuring both models operate on the same target distribution is a prerequisite for any meaningful comparison.
- ARIMA and LSTM tradeoffs are context-dependent. ARIMA is interpretable and efficient for stationary series with clear autocorrelation structure; LSTM offers flexibility for complex, nonlinear patterns but requires sufficient data and signal to justify the added complexity.
- Synthetic data has limits. This project would be extended meaningfully by replacing the synthetic target with real inventory or sales data where demand is genuinely influenced by time, seasonality, or promotional activity. A natural extension would be applying per-SKU models to real inventory data with engineered seasonal and promotional features.