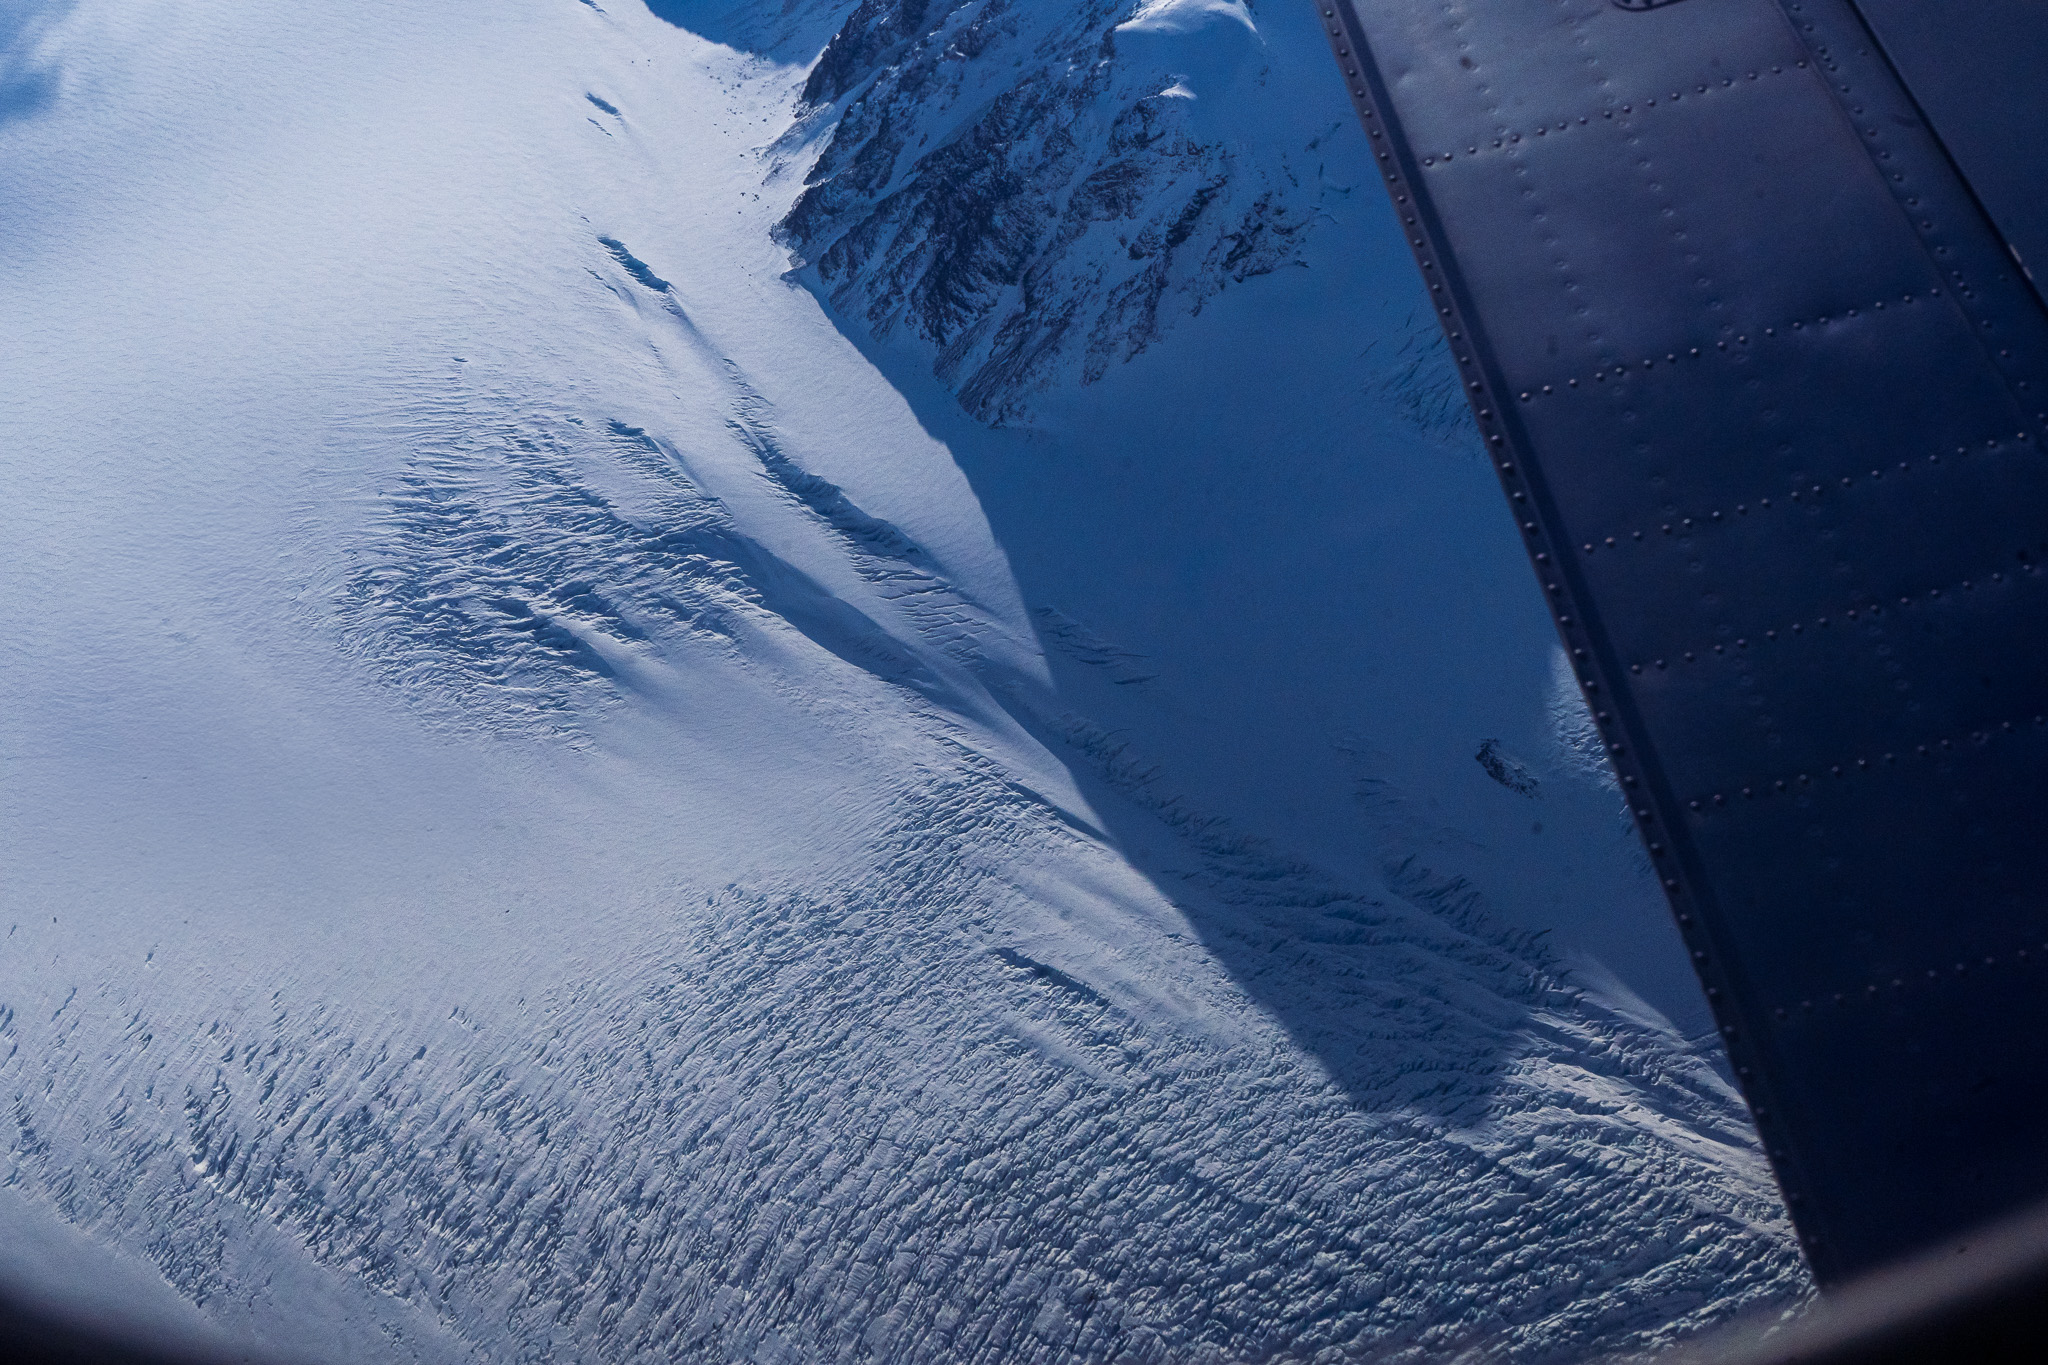
European Alps Snowpack Depths

PostgreSQL and Python project analyzing monthly snowpack trends across the European Alps using data from 2,794 weather stations. Focused on visualising seasonal changes, geographical differences, and high-elevation declines.

Github Repository
Visit Website
Arrow
Skills
Geospatial querying (PostGIS), SQL aggregation, seasonal trend analysis, data cleaning, interactive dashboards
Tools
PostgreSQL (PostGIS), Python (Pandas, GeoPandas, Plotly, Dash), GIS Data, Jupyter, Theil–Sen Regression

Project Overview

This project examines monthly snowpack depth trends across weather stations in the European Alps from 1936–2019. Using PostgreSQL, Python, and geospatial filtering within the Alpine Convention perimeter, I performed statistical tests (Mann-Kendall, Theil–Sen) to compare station-level (micro) and aggregated (macro) trends across months, countries, and elevation bands.

The project is presented through an interactive Dash app that allows users to explore snowpack patterns, statistical inferences, and regional variabilities.

Repository README

README

European Alps Average Monthly Snowpack Depths

A PostgreSQL and Python visualization project analyzing trends in monthly snow depths from 2,794 weather stations across Germany, Italy, France, Austria, Slovenia, and Switzerland. The focus is on average snowpack depth and how trends differ by country, month, and elevation band.

Project Overiew

This project isolates average snowpack depth across weather stations in the European Alps and compares station-level (micro) trends with aggregated (macro) trends.

Run A Local Dashboard Application

Run the Dash app to explore the project summary, figures, and conclusions.

Dashboard Screen Grabs & Visualistion Outputs

  • Dashboard Introdction Screengrab
    Dashboard Introduction

  • Dashboard Monthly Analysis Screengrab
    Dashboard Monthly Analysis

  • Distribution Of Station Slopes By Month
    Distribution of Station Slopes by Month

  • Theil-Sen Slopes of Elevation Band in Heatmap
    Elevation Band Heatmap

  • Theil-Sen Slopes of Country Snowpacks
    Country Snowpacks

Run Installation & Dash App

git clone https://github.com/Mitch-P-Analyst/Europe_Snowpack_Depths.git
cd Europe_Snowpack_Depths
git lfs install
git lfs pull
pip install -r requirements.txt
python -m app

Key Findings & Conclusion

Summary

Alpine winter snowpack is declining across much of the European Alps, with statistically significant, strongest losses at high elevations in early winter and early spring, led by Italy, Slovenia, Austria and Germany. While aggregated summaries are exaggerated in core months and muted in fringe months compared to station-level medians.

Category Summary
Total Stations 2,794
Stations Used (≥30 years) 795
Monthly Series Analyzed 5,309
Most Affected Region Italy, Slovenia, Austria
Most Affecteds Months November, April.
Strongest Signal High elevation stations
Aggregation Effect Overstates trends in core months

Findings

Station-level Trends:

  • Most individual station-month time series show negative Theil–Sen slopes.
  • Stronger declines are observed at higher elevations and during early winter and early spring months (Nov & Apr).

Geographical Patterns:

  • Southeast Alpine countries (Italy, Slovenia, Austria) display the strongest consistent declines.
  • North/west countries (France, Switzerland, Germany) show more muted or mixed signals.

Aggregation Effect:

  • Aggregated time series tend to overstate declines in core months and understate changes in fringe months, compared to the median station-level trend.
  • This reinforces the need to interpret macro summaries with caution and to distinguish from station-level variability.

Data Reliability:

  • Only stations with ≥ 30 years of winter data were retained (reducing the sample from 2,794 to 795), improving statistical confidence but limiting coverage at some elevations.
  • Further outlier cleaning was explored but had minimal effect on overall conclusions.

Tools

  • Pandas
  • Plotly
  • pymannkendall
  • Stats
  • Shapely
  • GeoJson

Repository Structure

├── app/                                                  
│   │ ├── app.py                                          # DASH application
│   │ ├── __main__.py                                     
│   │ ├── assests/                                        # DASH application styling
│   │ │ ├── style.css               
│   │ │ ├── style.css.map           
│   │ │ └── style.scss                                    # Master scss styling
├── Data/ 
│   ├── Artifacts/
│   │ └── alps_mask.gpkg                                  # European Alps Boundary Masks   
│   ├── Cleaned/       
│   │ ├── Tests/                                          # Statistical Analysis Data Sheets  
│   │ │ └── /
│   │ └── /                                               # Cleaned SQL Data outputs from 01_Data_Cleaning.sql
│   └── Raw/     
│     ├── Alpine_Convention_Perimeter_2025/               # Alpine Convention Perimeter data
│     └── European Alps Snow Depth Observations Data/     # Zenodo European Alps Snow Depth Observations
├── Notebooks/                                            # Notebooks/
│   ├── 02_EDA.ipynb
│   ├── 03_Statistical_Testing.ipynb
│   └── 04_Visualisations.ipynb
├── Outputs/  
│   ├── Data_ERD.png                                      # SQL ERD Output
│   ├── weather_stations_in_alps.png                      # Visualisation of Alpine Convention Perimeter filtering
│   └── yearly_snowpack_reliability.png                   # Visualisation of time frame filtering
├── Scripts/  
│   ├── app.sql
│   ├── 01_Data_Cleaning.sql
│   ├── figures.py                                        # 04_Visualisation & DASH App figure functions
│   └── functions.py                                      # Statistical Testing custom functions
├── .gitattributes
├── gitignore
├── requirements.txt
└── README.md

Data

Source

Content

  • Zenodo European Alps Snow Depth Observations (1865–2019), filtered to the Alpine Convention 2025 perimeter.
  • Analysis Sample: 795 stations after QA (≥ 30 winters of data), producing 5,309 station-month time series (1936–2019).

Data Manipulation

  • Metadata of 2979 Available weather stations
    • condensed to 2794 in relevance to avaiable Monthly Snowpack Depths from 12 providers.
      • Reduced to 795 stations after QA (≥ 30 winters of data) producing 5,309 station-month time series
  • Monthly snow depth (hnsum) per station
  • Time range: 1864–2024
    • Reduced to 1936 – 2019 to abide by ≥ 30 winters of data threshold.

Data Objectives

  • Clean and normalize entities for weather data analysis
  • Calculate average winter seasonal snowpack depth for each weather station
  • Consolidate monthly snowpack data from 12 providers into one entity
  • Analyze statistically significant trends across numerous groupings
  • Visualise Theil-Sen slopes for monotonic trends across categories countries, months and elevation bands
  • Conclude inference from statistical models for winter snowpack trend.

SQL Database Schema

  • weather_stations: European Alps Weather station metadata
    ([SerialPK] Station_id ,
    name,
    latitude,
    longitude,
    elevation (metres),
    country,
    provider )
  • (monthy_snowpack): Average monthly snowpack per weather station
    ([PK] id,
    [FK] Station_id,
    year,
    month,
    hnsum
    )

Procedure

01 Data Cleaning

  • SQL File

    • 01_Data_Cleaning.sql
      • Base filtering
      • Aggregated table creation
  • Data Import Instructions (PostgreSQL)
    To load the raw metadata and snowpack data from CSVs into PostgreSQL, use the following command:

COPY weather_stations
FROM './Data/Raw/European Alps Snow Depth Observations Data/meta_all.csv'
DELIMITER ',' CSV HEADER;

02 Exploratory Data Analysis (EDA)

  • View & Learn Data

  • Clean & Organise Data

    • Segregate by 'Winter' months
    • Identify Stations in European Alps
    • Data Filtering
      • Assess Data Validity
      • Focus Range
      • Filter by Country
      • Filter by Elevation Band

03 Statistical Testing

Mann-Kendall Test
- Function & Application

  • Station-Centric (micro perspective)

    • Station-Month time series
    • Station-Month time series by Country / Month
    • Station-Month time series by Country
  • Region-Centric (macro perspective)

    • Slope Per Country & Month
    • Slope Per Month
    • Slope Per Elevation Band & Month

04 Visualisations

  • Station Coverage
  • Country Trends
    • Distribution Of Station Slopes Per Country Month
    • Country-Year Mean Snowpack Series
  • Month Trends
    • Distribution Of Station Slopes Per Month
    • Month Mean Snowpack Series
    • Country Month Heatmap
  • Elevation Band
    • Elevation Band Heatmap
Github Repository
Visit Website
Arrow