Mitchell Palmer
Scientific Data Analyst
A capstone project for the Google Advanced Data Analytics certification, this exploration investigates trends and variable associations through classification models between employee departures at the fictional Salifort Motors company.

As the capstone for the Google Advanced Data Analytics certificate, this project uses a fictional human-resources dataset from Kaggle to investigate attrition at Salifort Motors.
With recent turnover at Salifort Motors, I was tasked with investigating the drivers of attrition and providing data-driven recommendations using machine-learning models to help mitigate future departures. If Salifort could predict whether an employee will leave the company, and discover the reasons behind their departure, they could better understand the problem and develop a solution. The goal is to understand what makes an employee likely to leave.
I analyzed a 15k-row human resources dataset for Salifort Motors to understand drivers of attrition. Data visualisation showed associations between key working environment variables and employee departure. I produced an Executive Summary for stakeholder communication to summarize the project's discoveries.
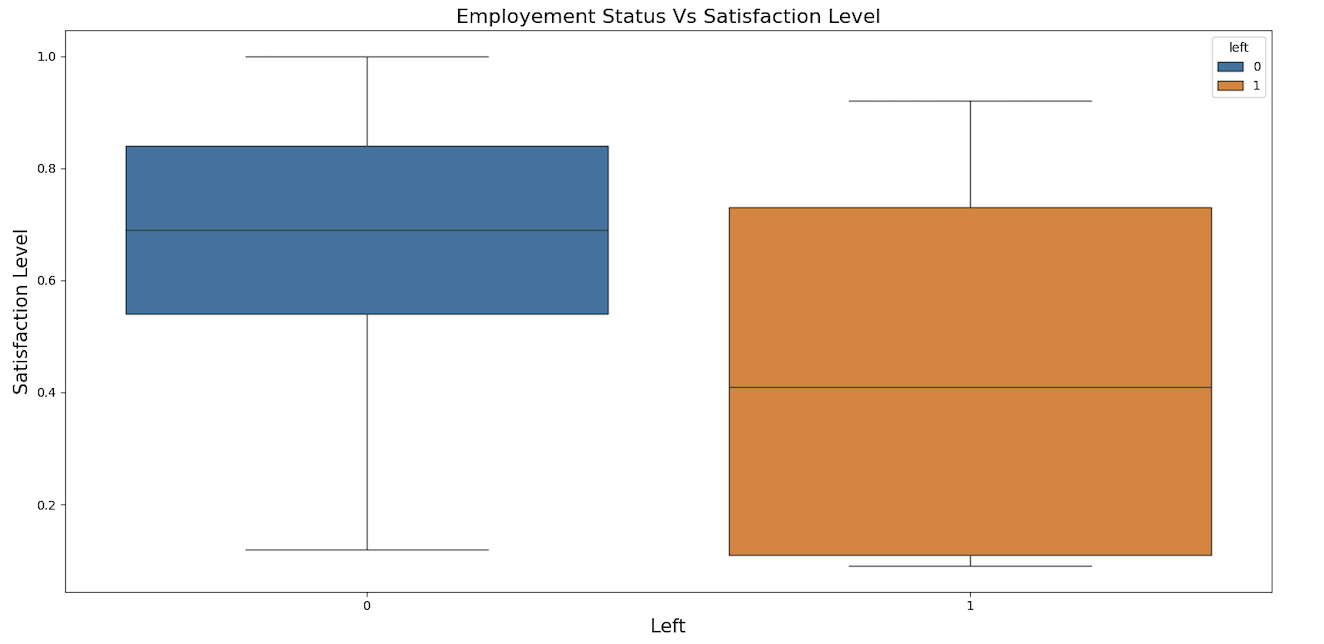
Employees with more projects, higher monthly hours, longer tenure, and lower satisfaction were much more likely to leave. This was first identified through visualisations of associated influencing variables, followed by machine learning models to predict employee attrition.
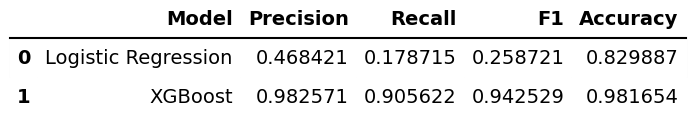
Applying Logistic Regression and XGBoost models, I constructed a best-fitting prediction model to assess employee attrition, validating visualised variable associations. Using logistic regression as a baseline and a tuned XGBoost model for comparison.
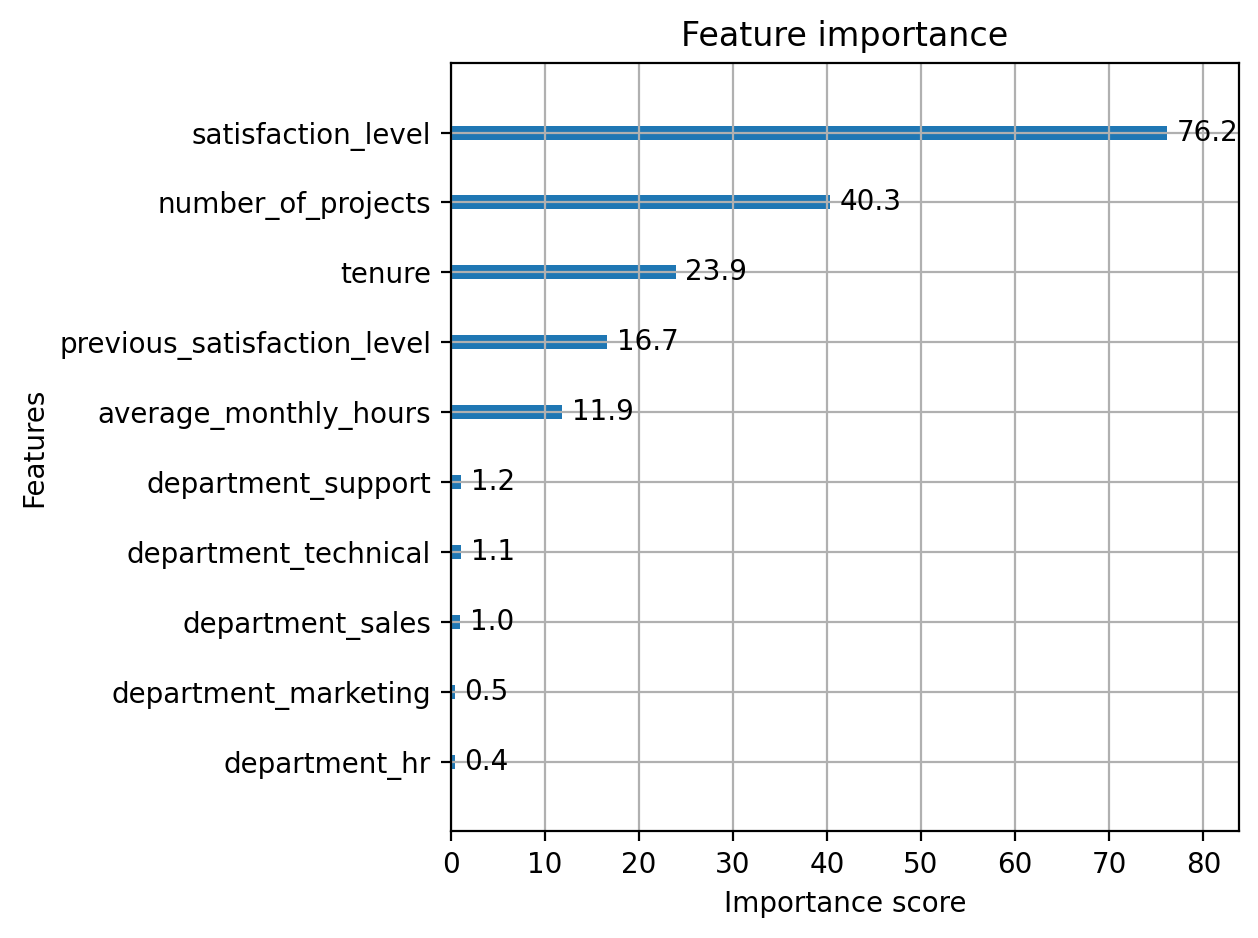
Employees working on higher number of projects, a workload with higher monthly hours, longer tenure, lower satisfaction, are much more likely to leave.
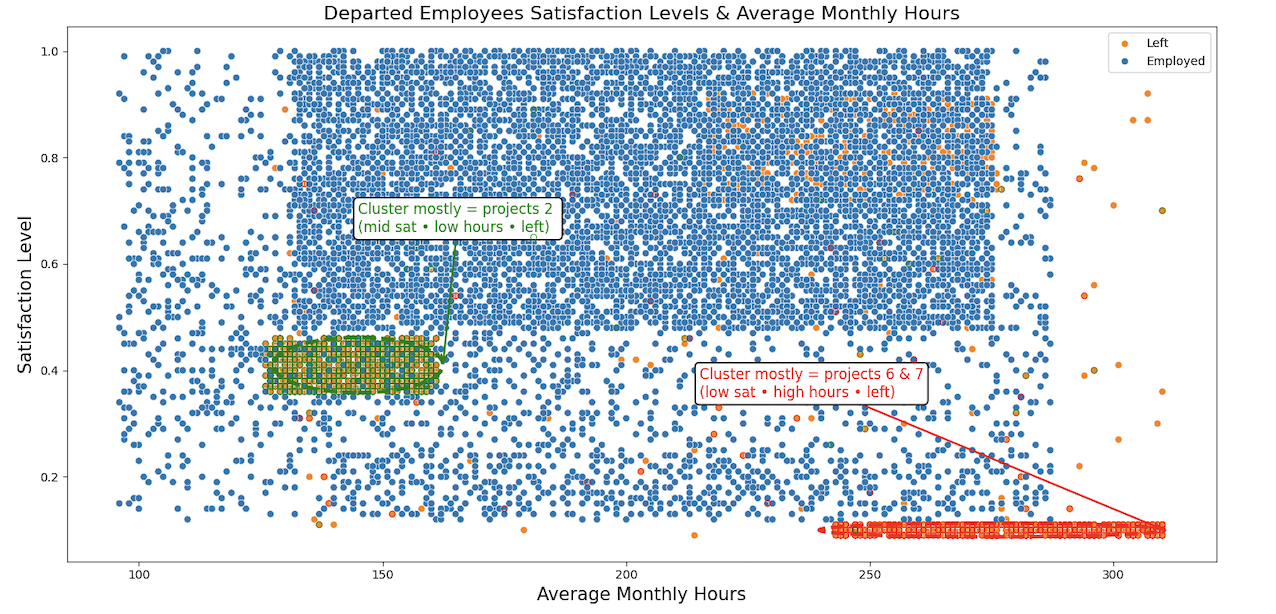
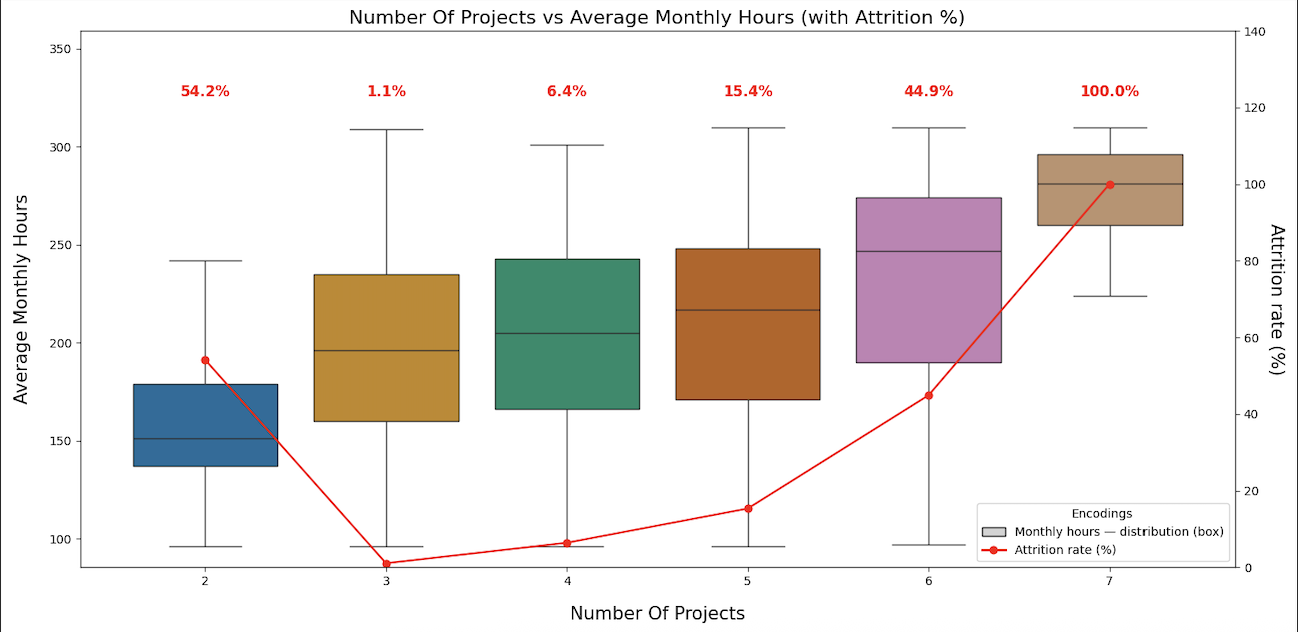
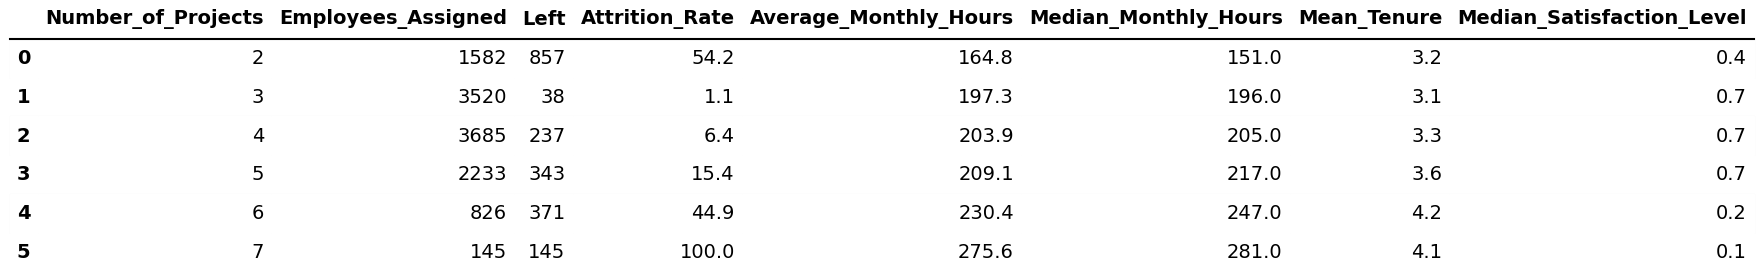
Departed employees with the lowest satisfaction levels were assigned to 6 or 7 different projects. Examining all employees, past and present, from data provided, employees assigned to 6 or 7 projects are associated with the highest average monthly hours and are tenured employees around ≈4 years.
Reflecting upon the above visualisations and numbers presented in Project Statistics, this investigation recommends targeting the variables most strongly associated with employee departure.
Further steps to improve this investigation may include
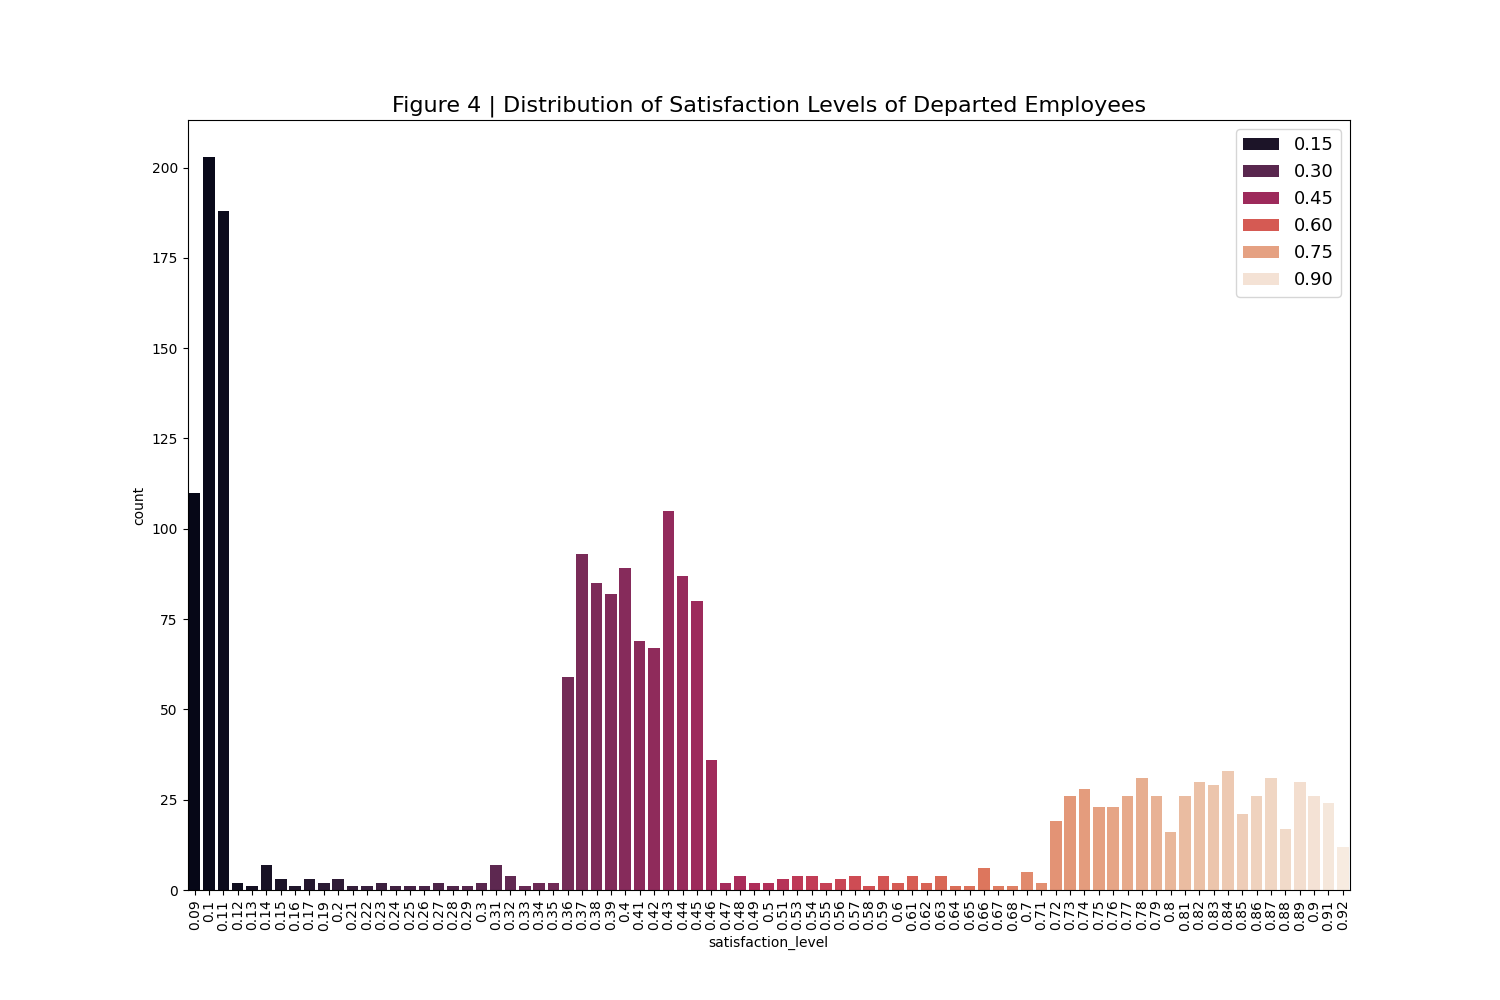
The data shows significant quantities of employees departed with medium and high satisfaction levels, primarily from collection of employees assigned to 2 project and in the departments of sales and human resources.
Distinguishing between how employees left Salifort may assist in analyzing where employee resources may be reassigned to compensate over-worked employees working on 6 or 7 projects.
For those interested, the GitHub repo includes Jupyter notebooks for EDA, prediction models, and figure generation.